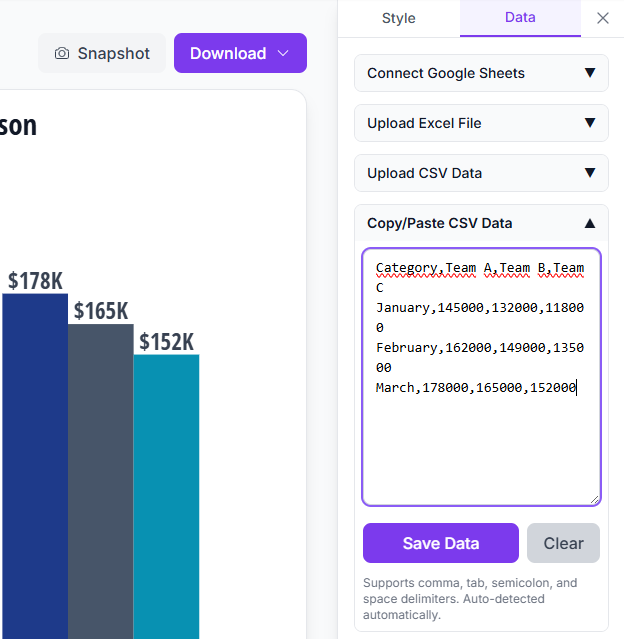
Charts built for storytelling.
Find&Tell Charts gives you full control over styling, headlines, and emphasis. Create in Figma or on the web. Use anywhere.
Compare with clarity.
Bar charts make comparisons obvious. Use them to show rankings, highlight winners, or contrast categories.
With Find&Tell, you control the emphasis—draw attention to the bar that matters, mute the ones that don't.
Show trends
that matter.
Line charts reveal patterns over time. Use them to show growth, decline, or turning points in your data.
Add emphasis to the moment that matters. Let your audience see the trend—and the story behind it.
Before and after, made clear.
Slope charts show change between two points. Use them when the shift is the story—not the journey.
Perfect for showing improvement, decline, or comparison between two time periods.
See where you lose them.
Funnel charts visualize stages and dropoff. Use them to show conversion, retention, or any process with steps.
Highlight the stage where the problem lives. Make the dropoff impossible to ignore.
Compare multiple metrics at once.
Merged bar charts show several measures side by side across categories. Use them to easily compare KPIs across regions, segments, or time periods in a single view.
See the full picture without flipping between charts. Highlight patterns across dimensions instantly.
Make percentages tangible.
Waffle charts turn proportions into a grid of squares. Use them for survey results, goal progress, or any part-to-whole comparison where precision matters.
More intuitive than pie charts. Easier to compare. Harder to ignore.
How it Works
Bring your data. Style it. Use it anywhere.
Bring Your Data
Copy-paste from any spreadsheet. Upload a CSV. Upload an Excel sheet. Connect to Google Sheets.
Edit directly in the plugin. Your data, your way.
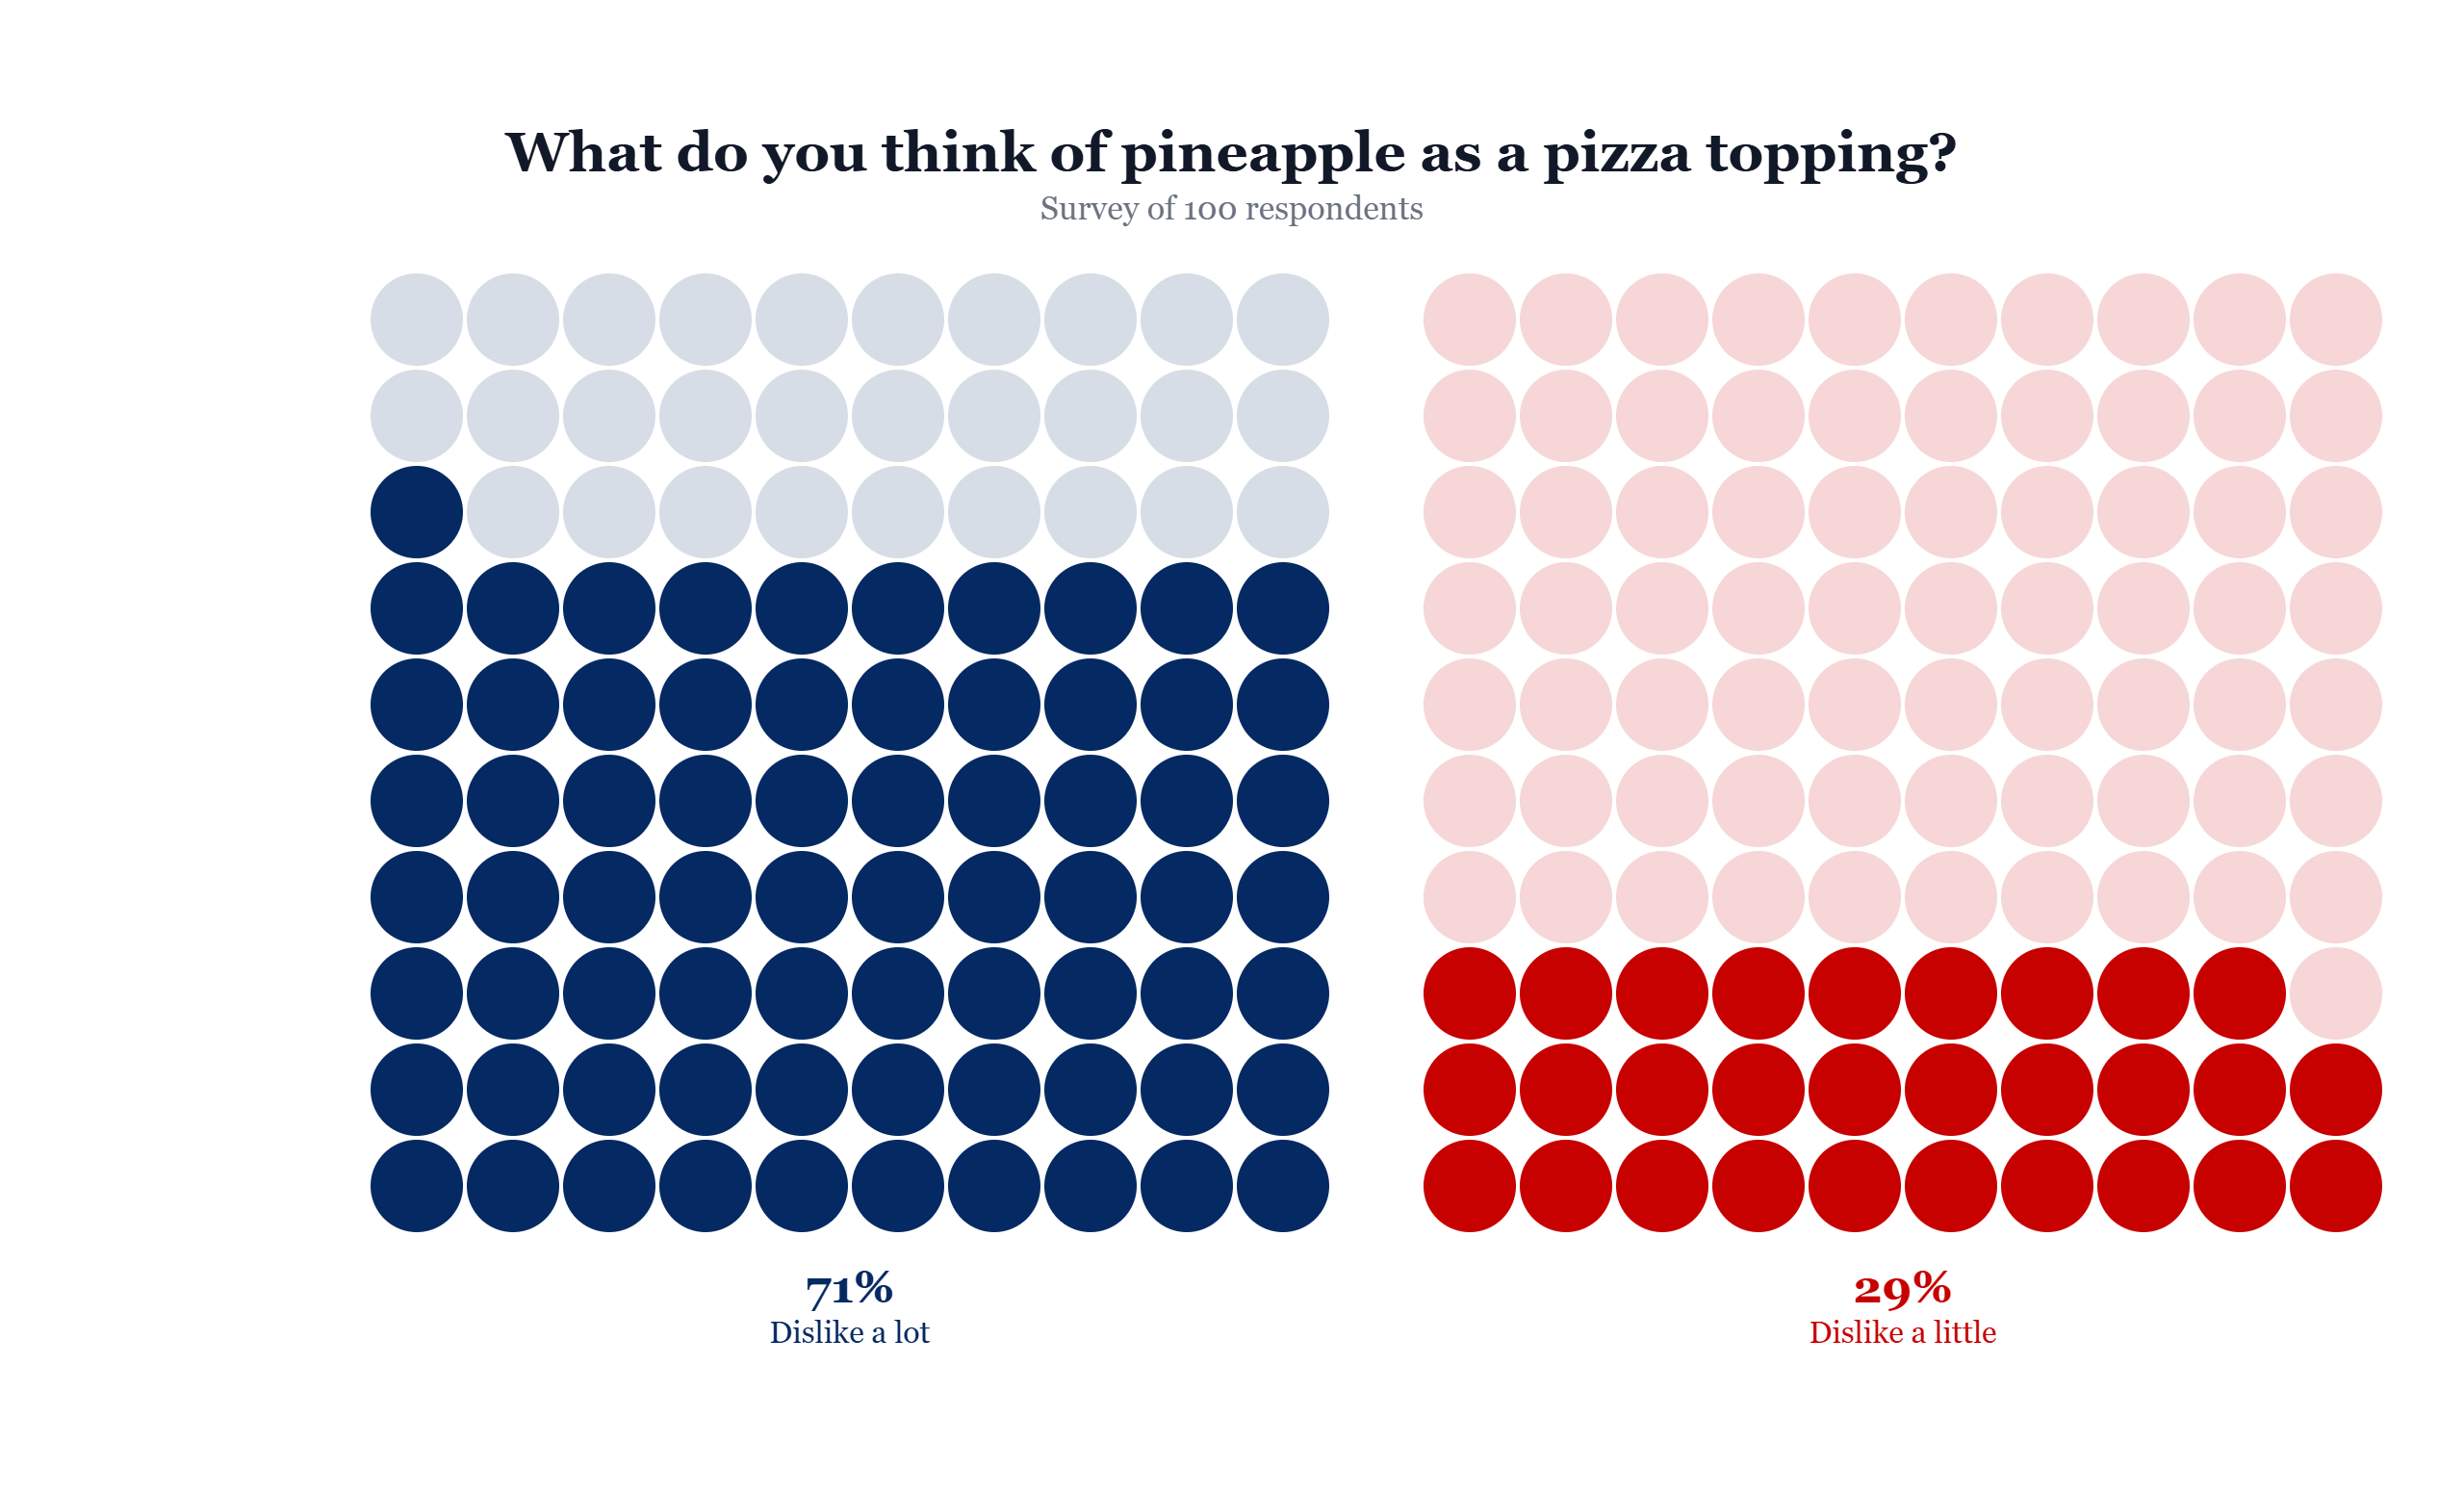
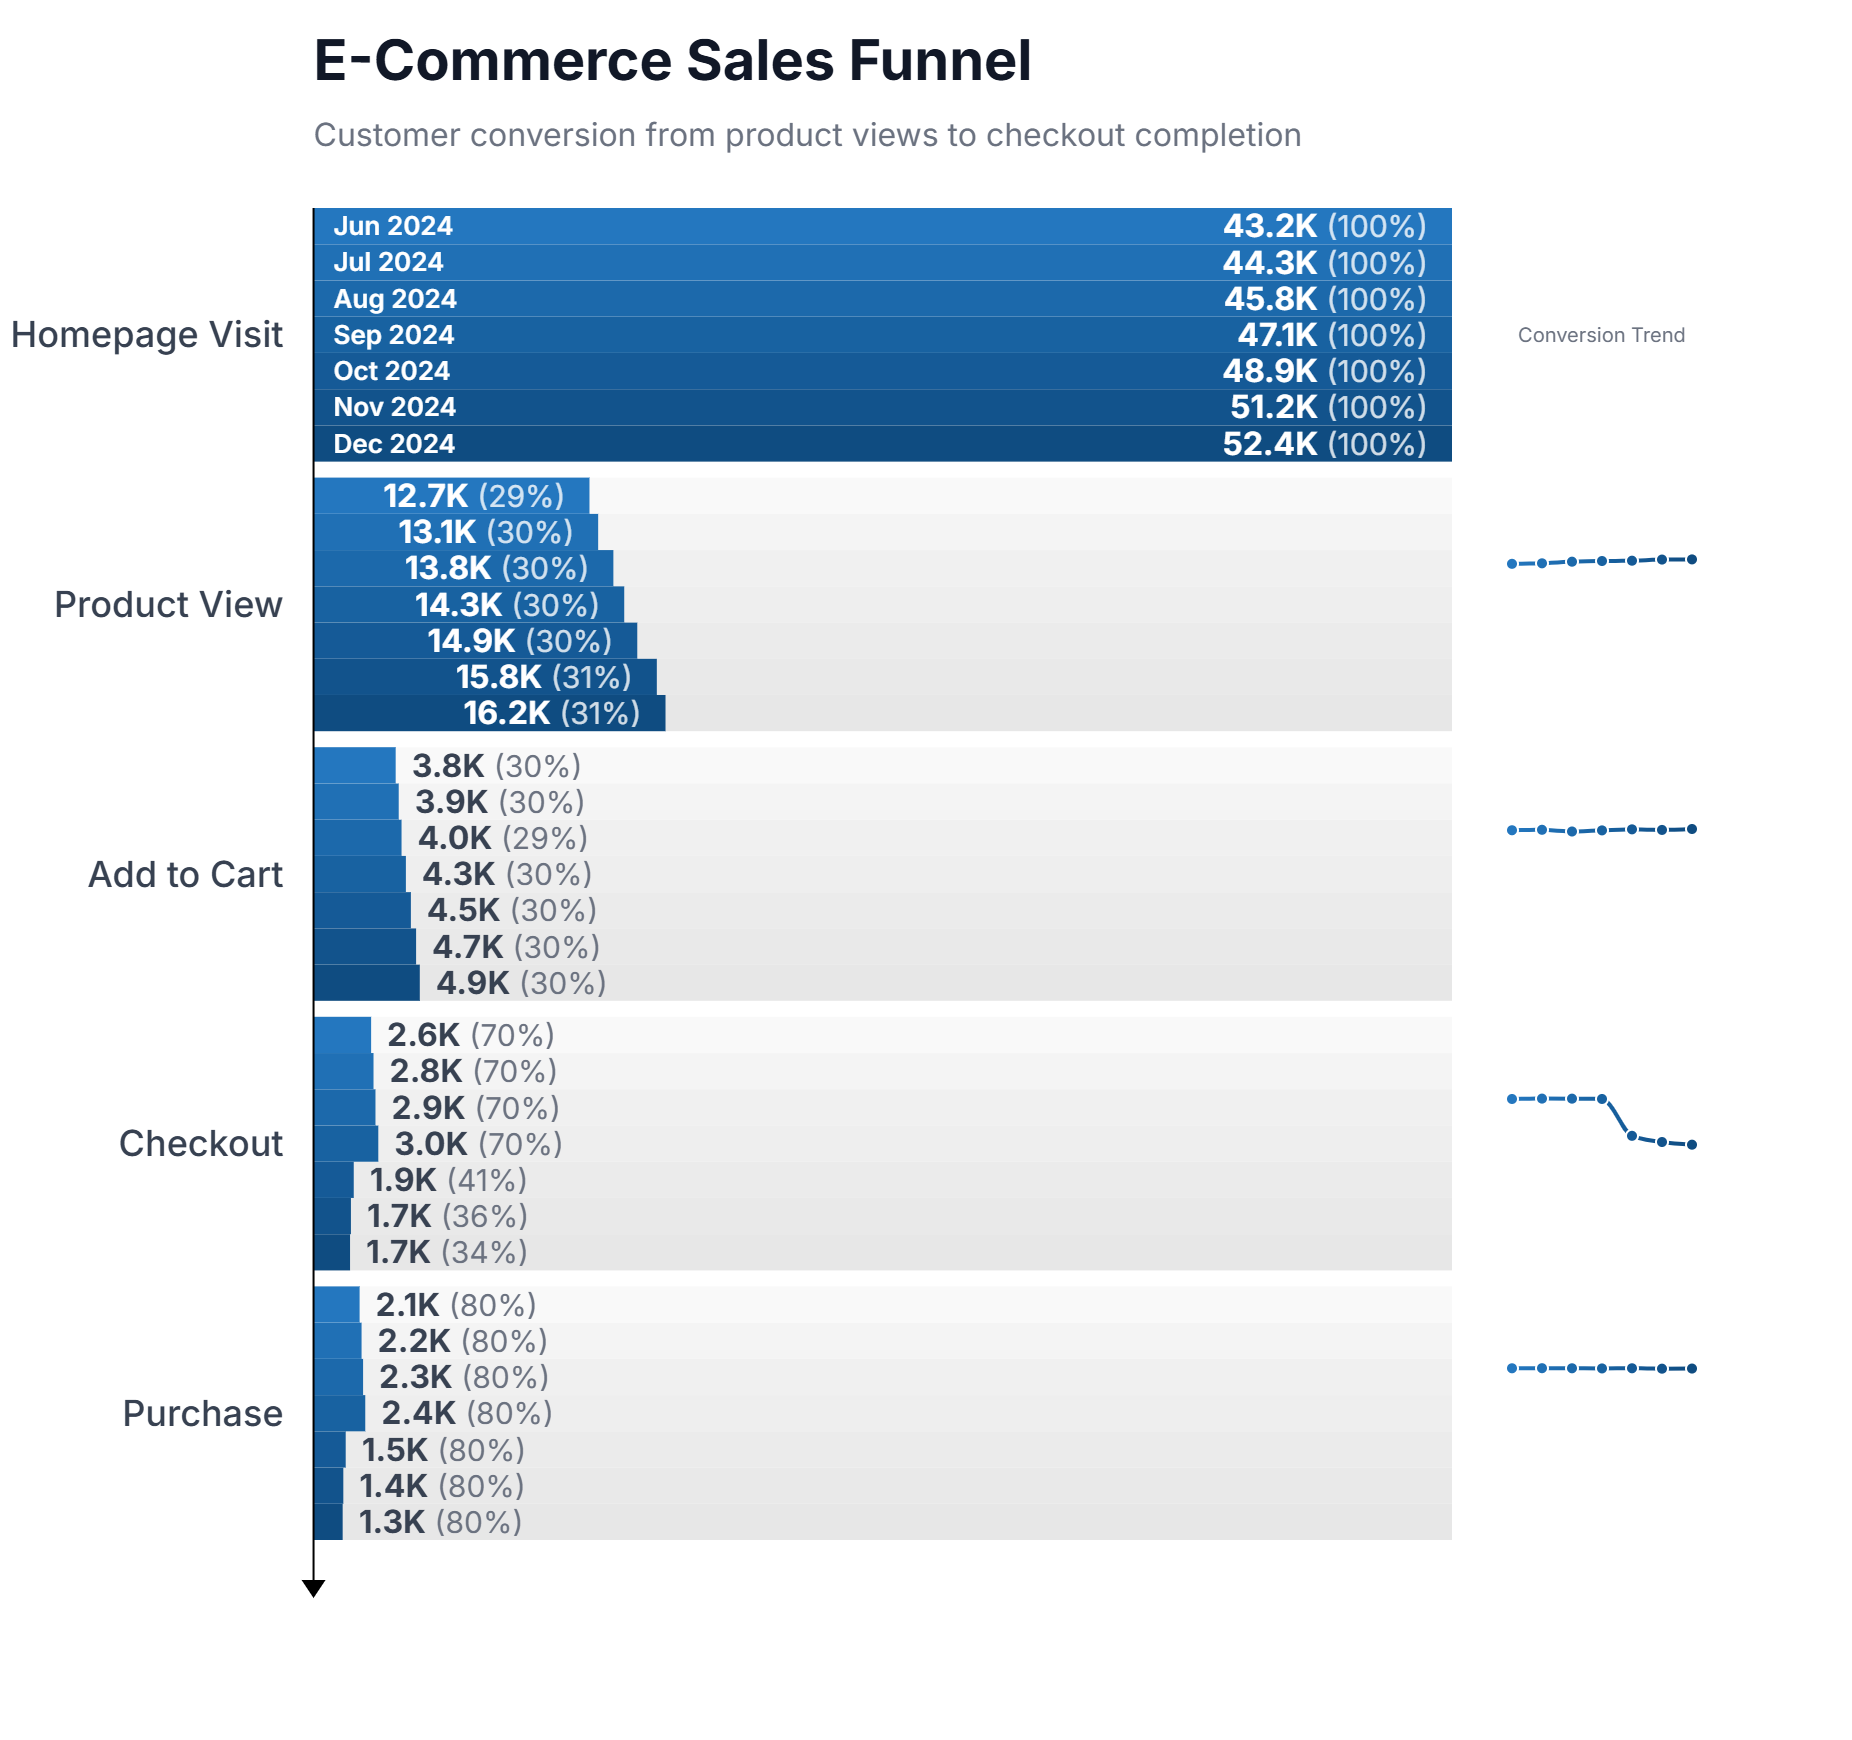
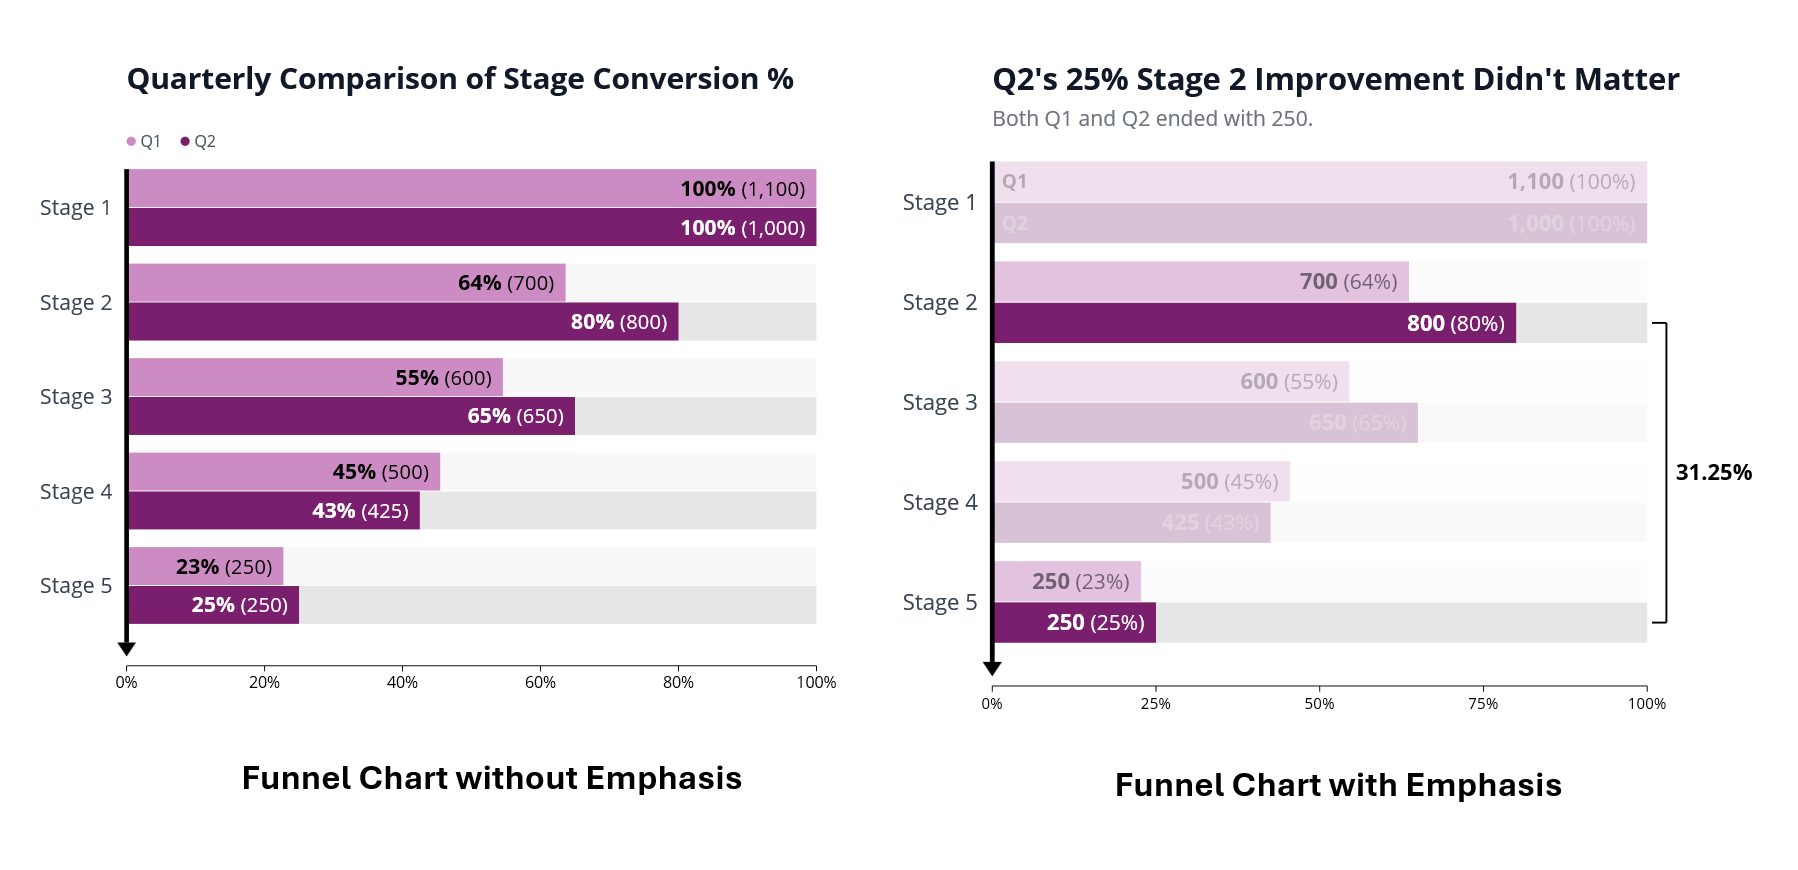
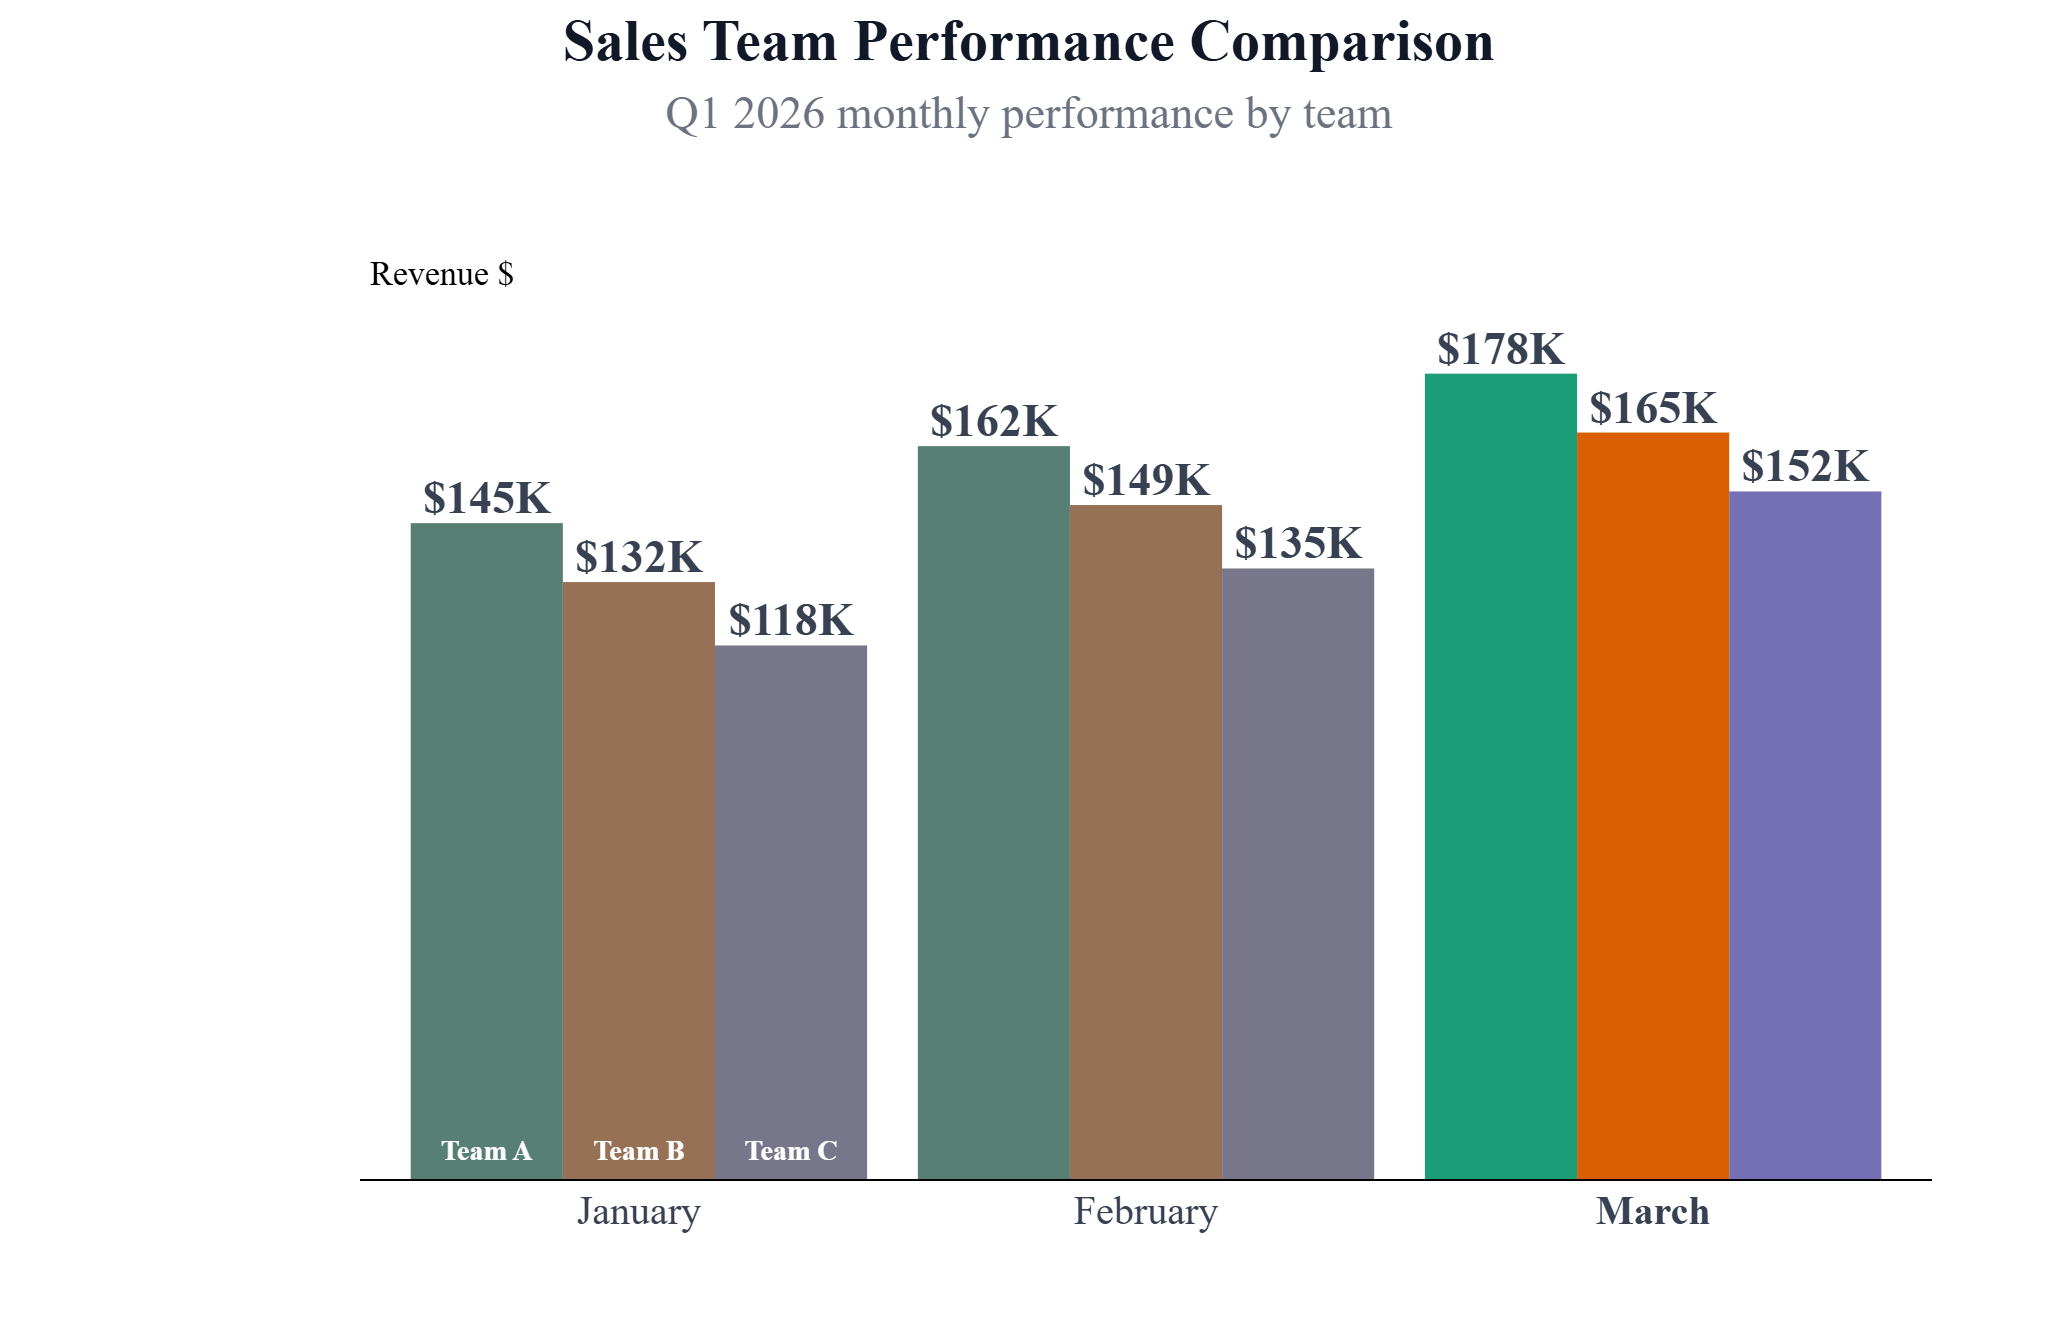
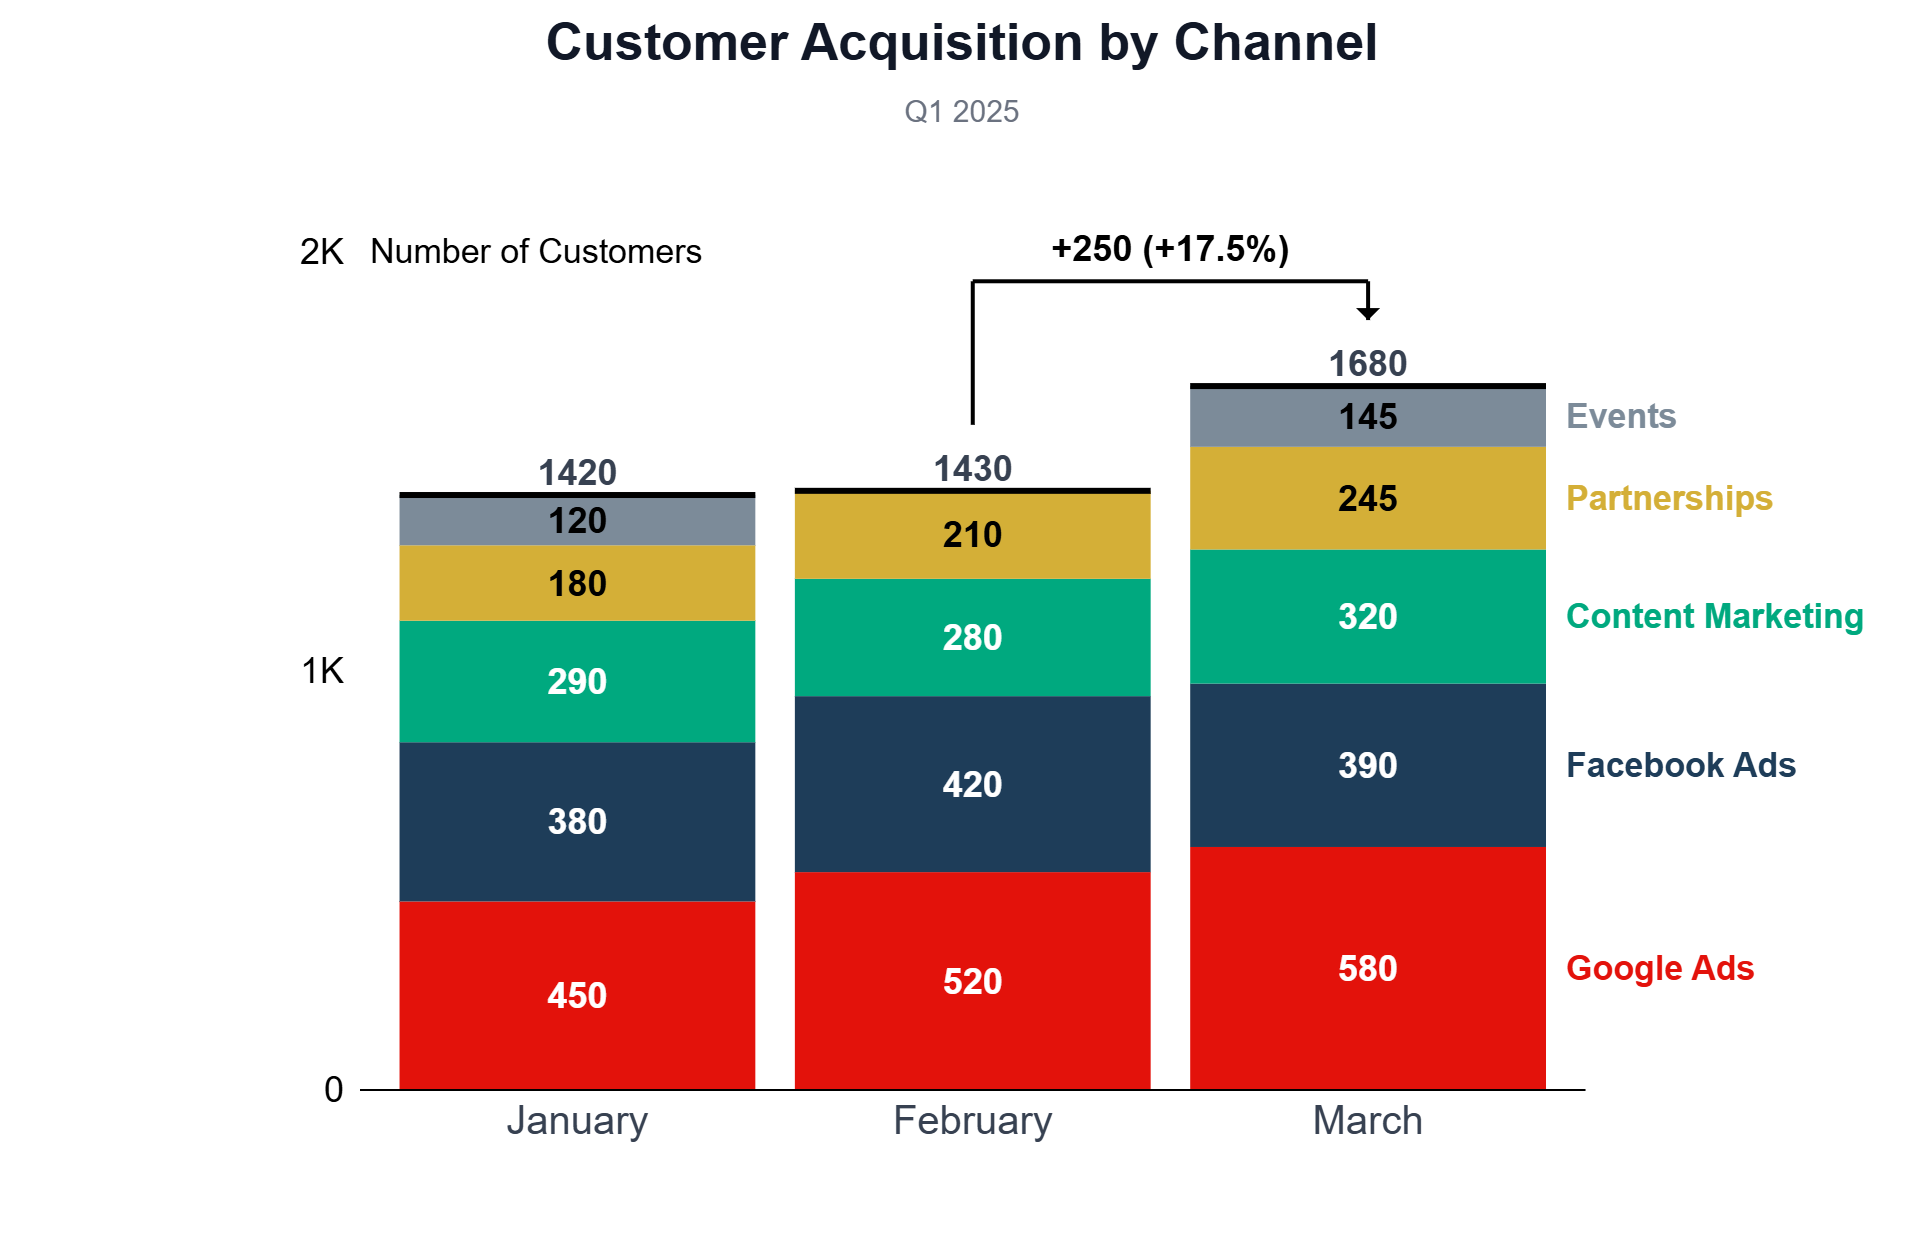
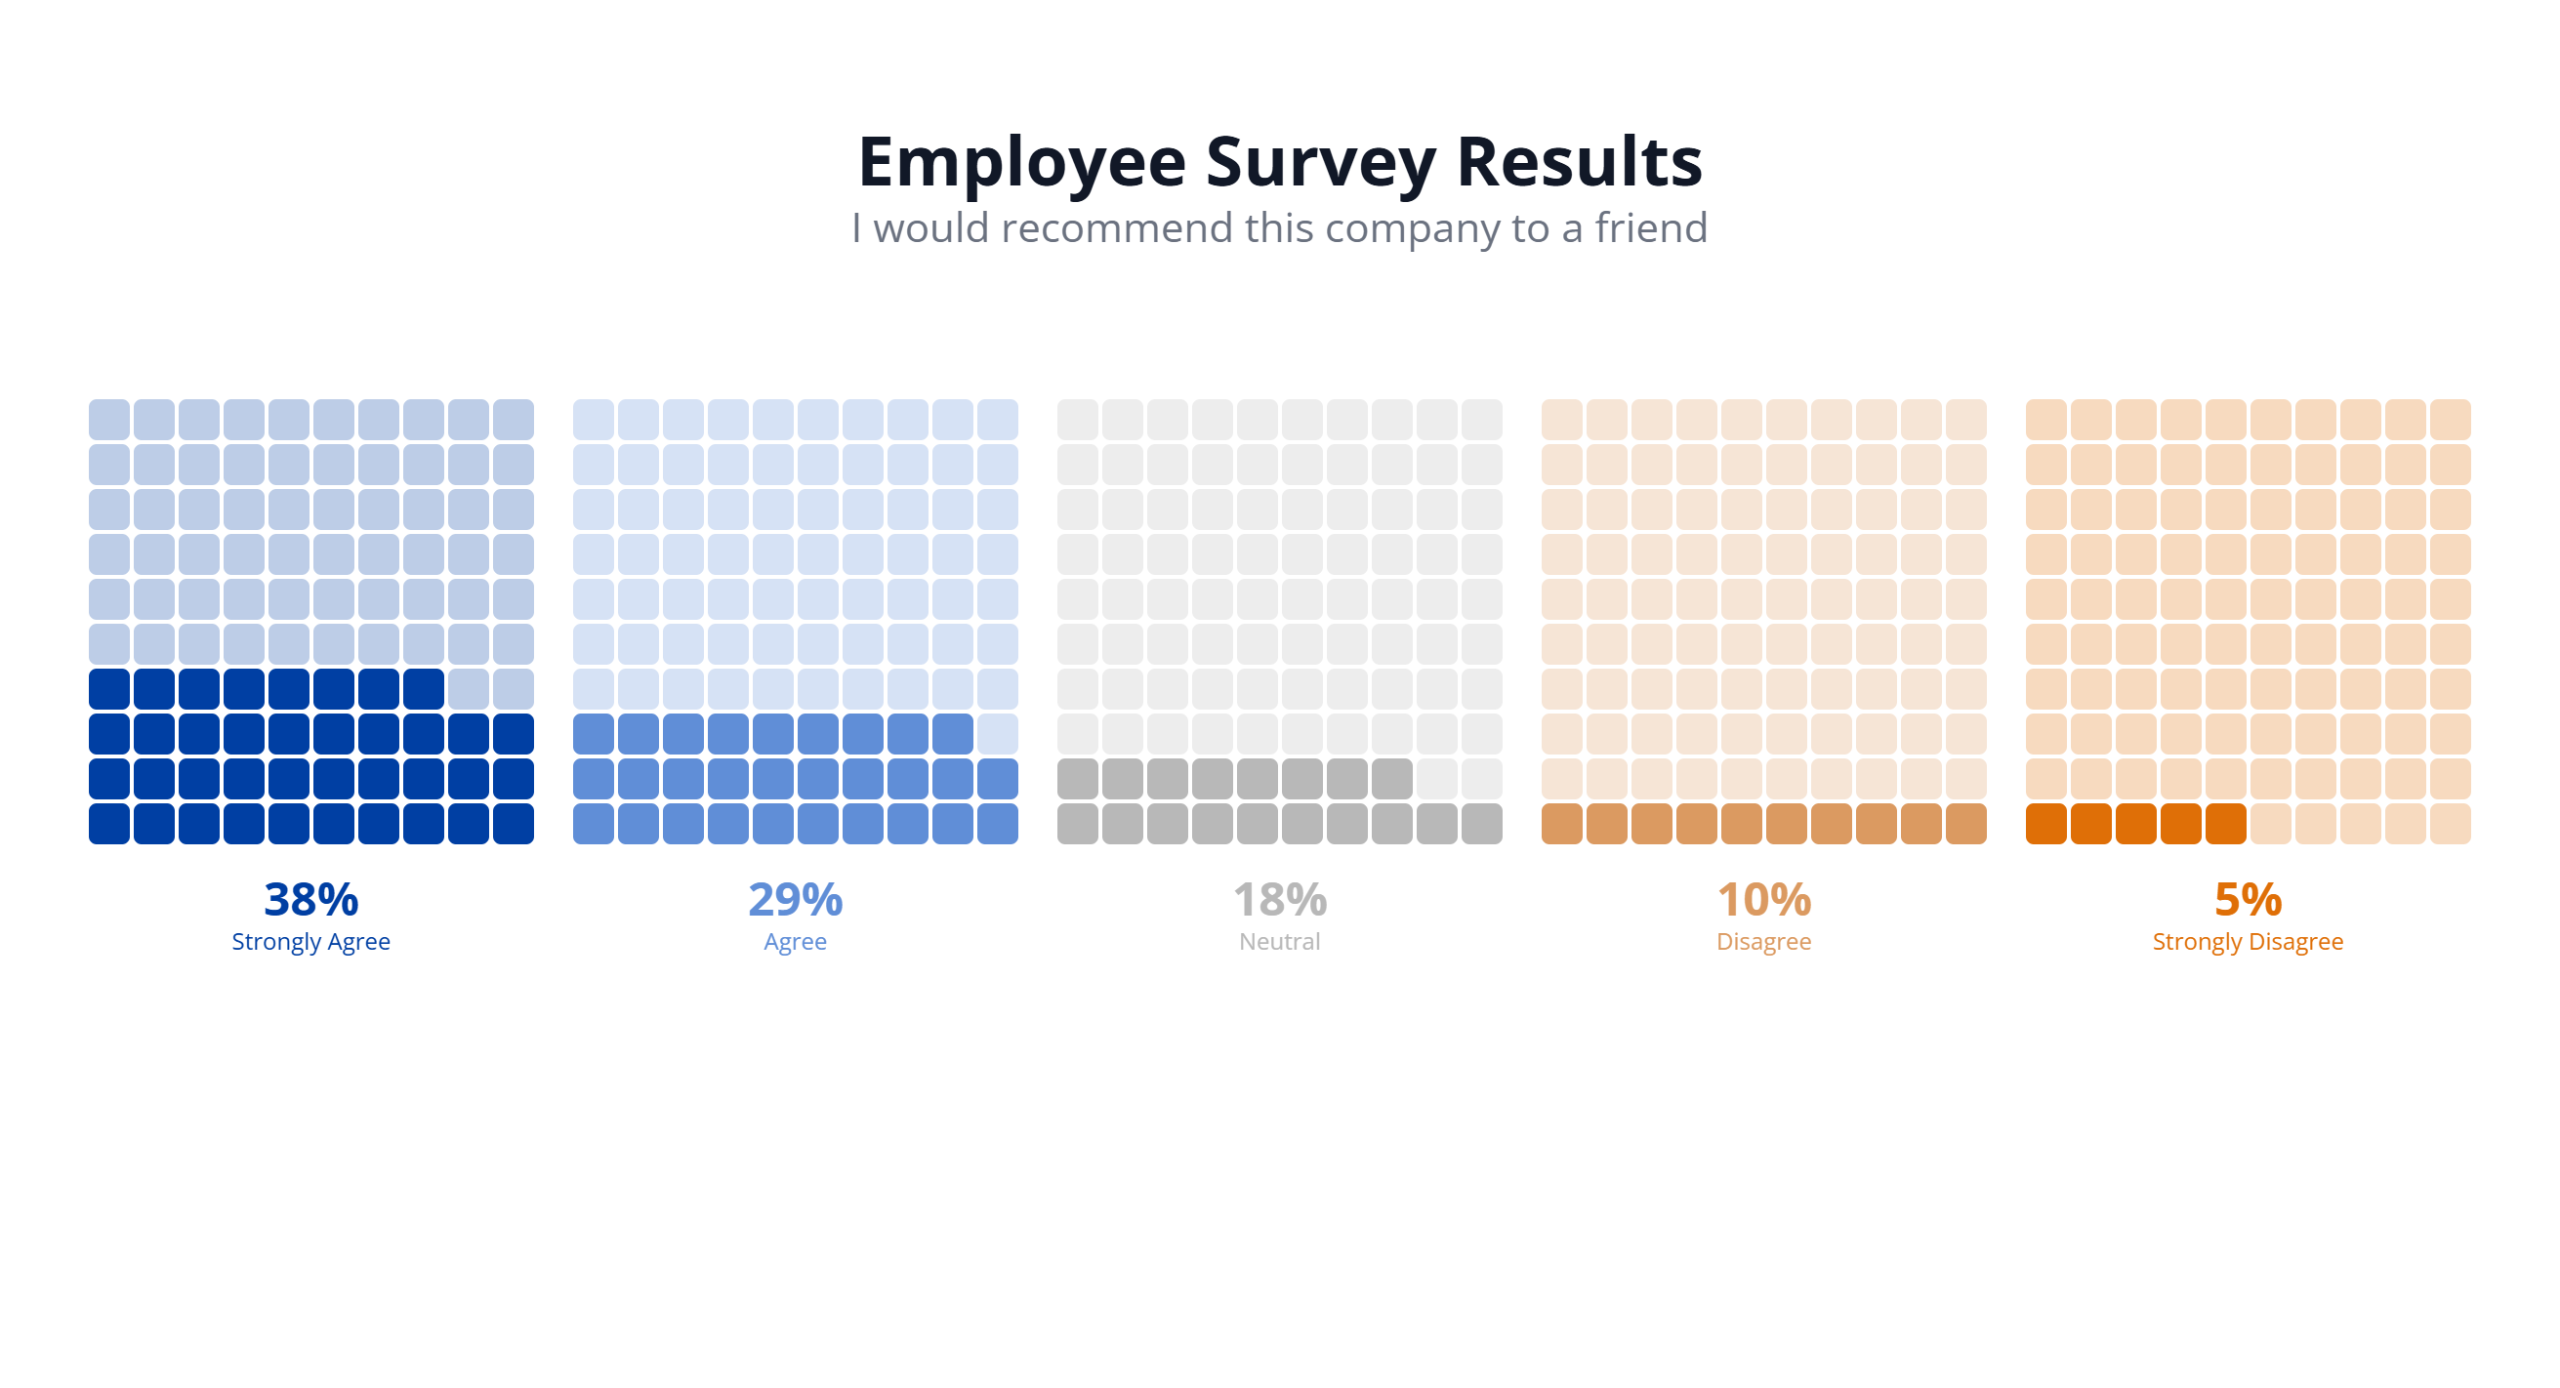
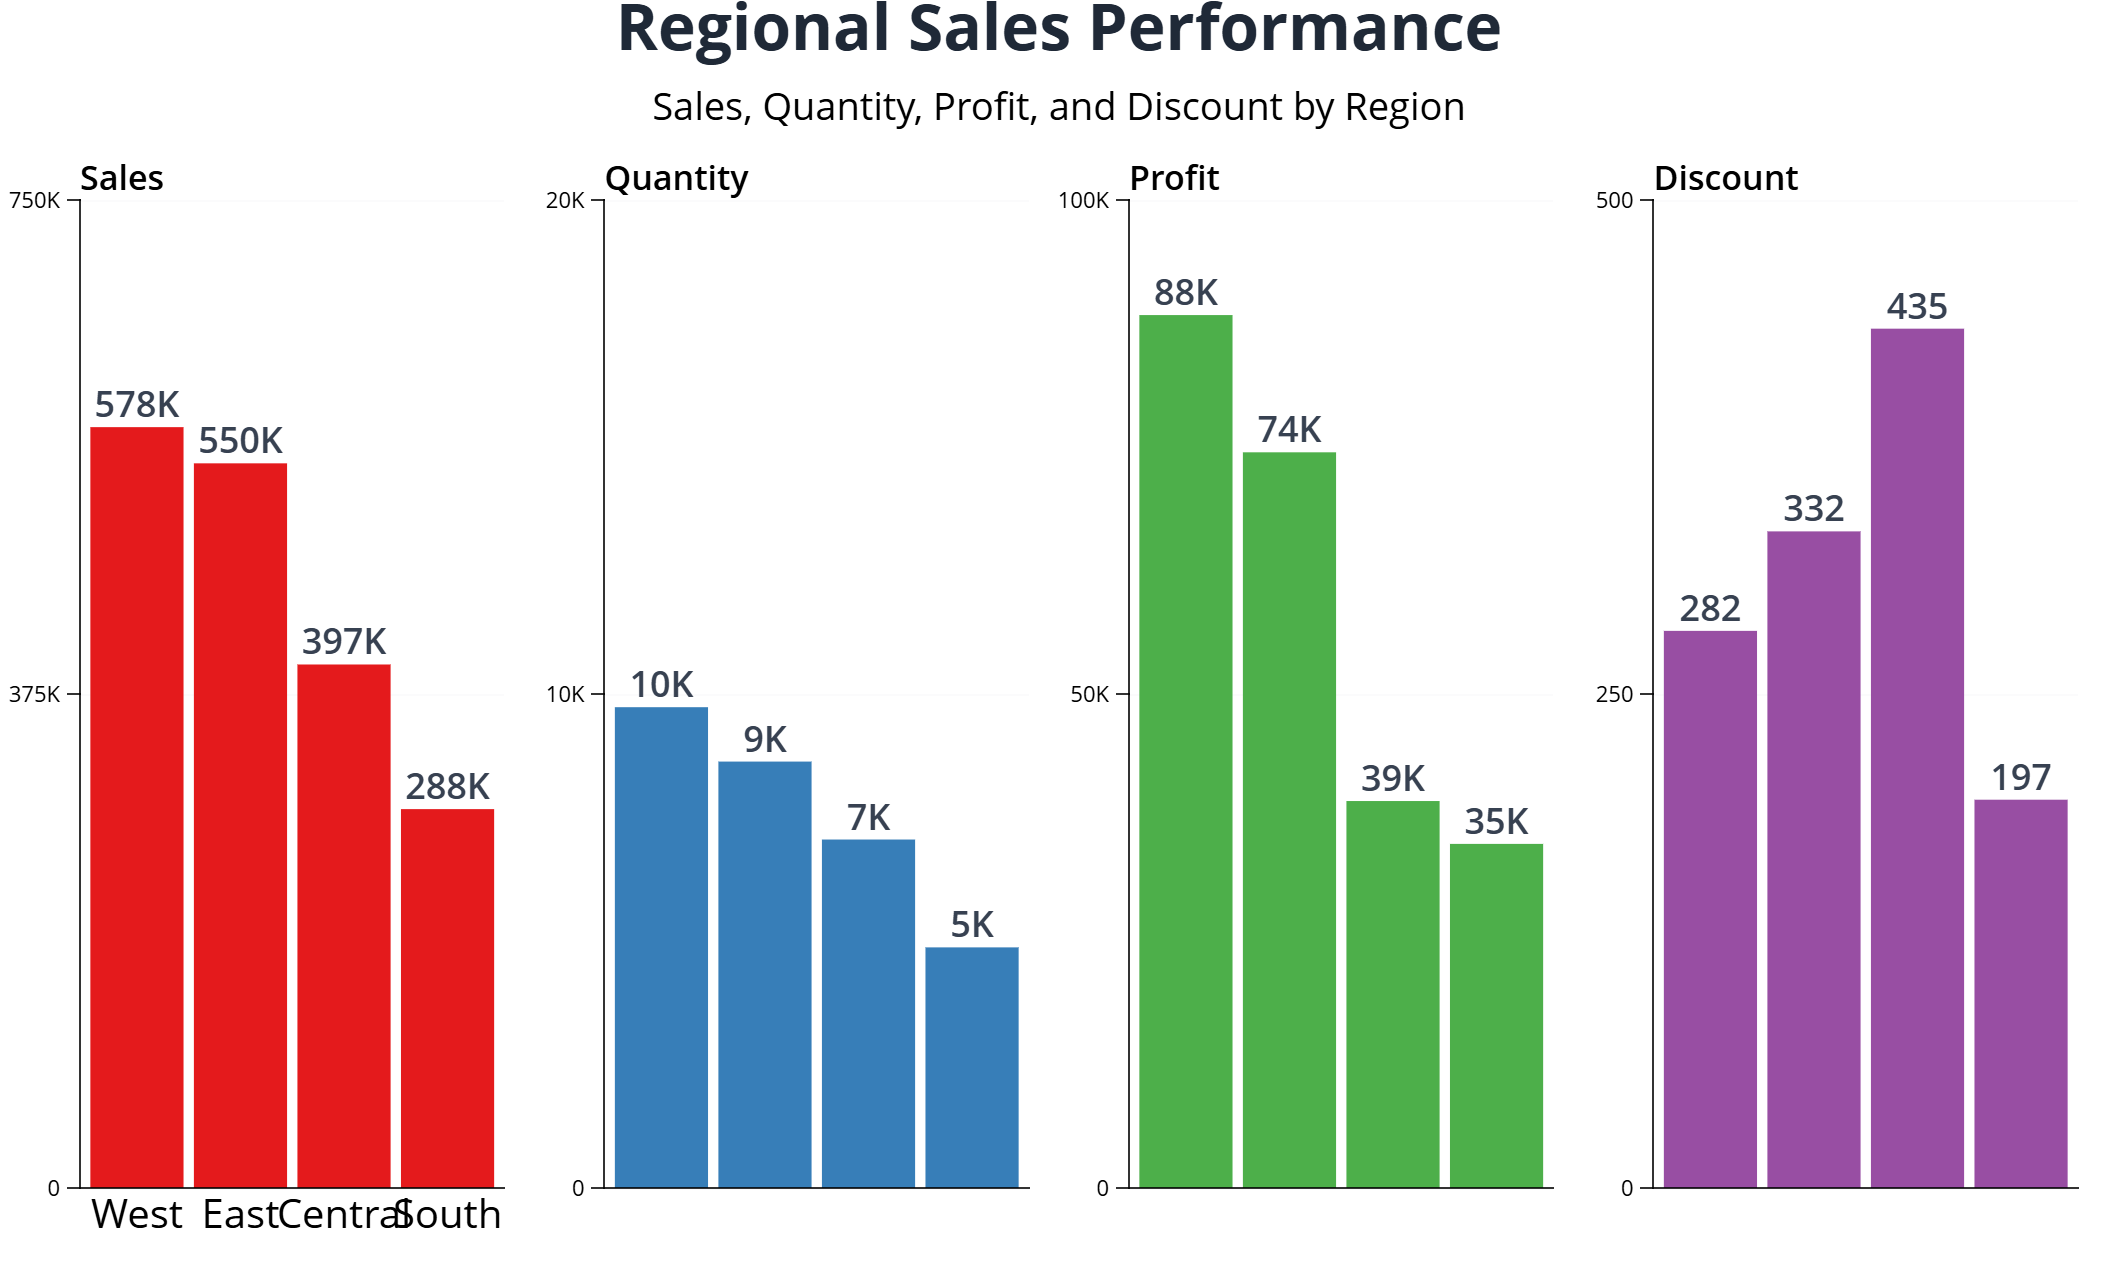
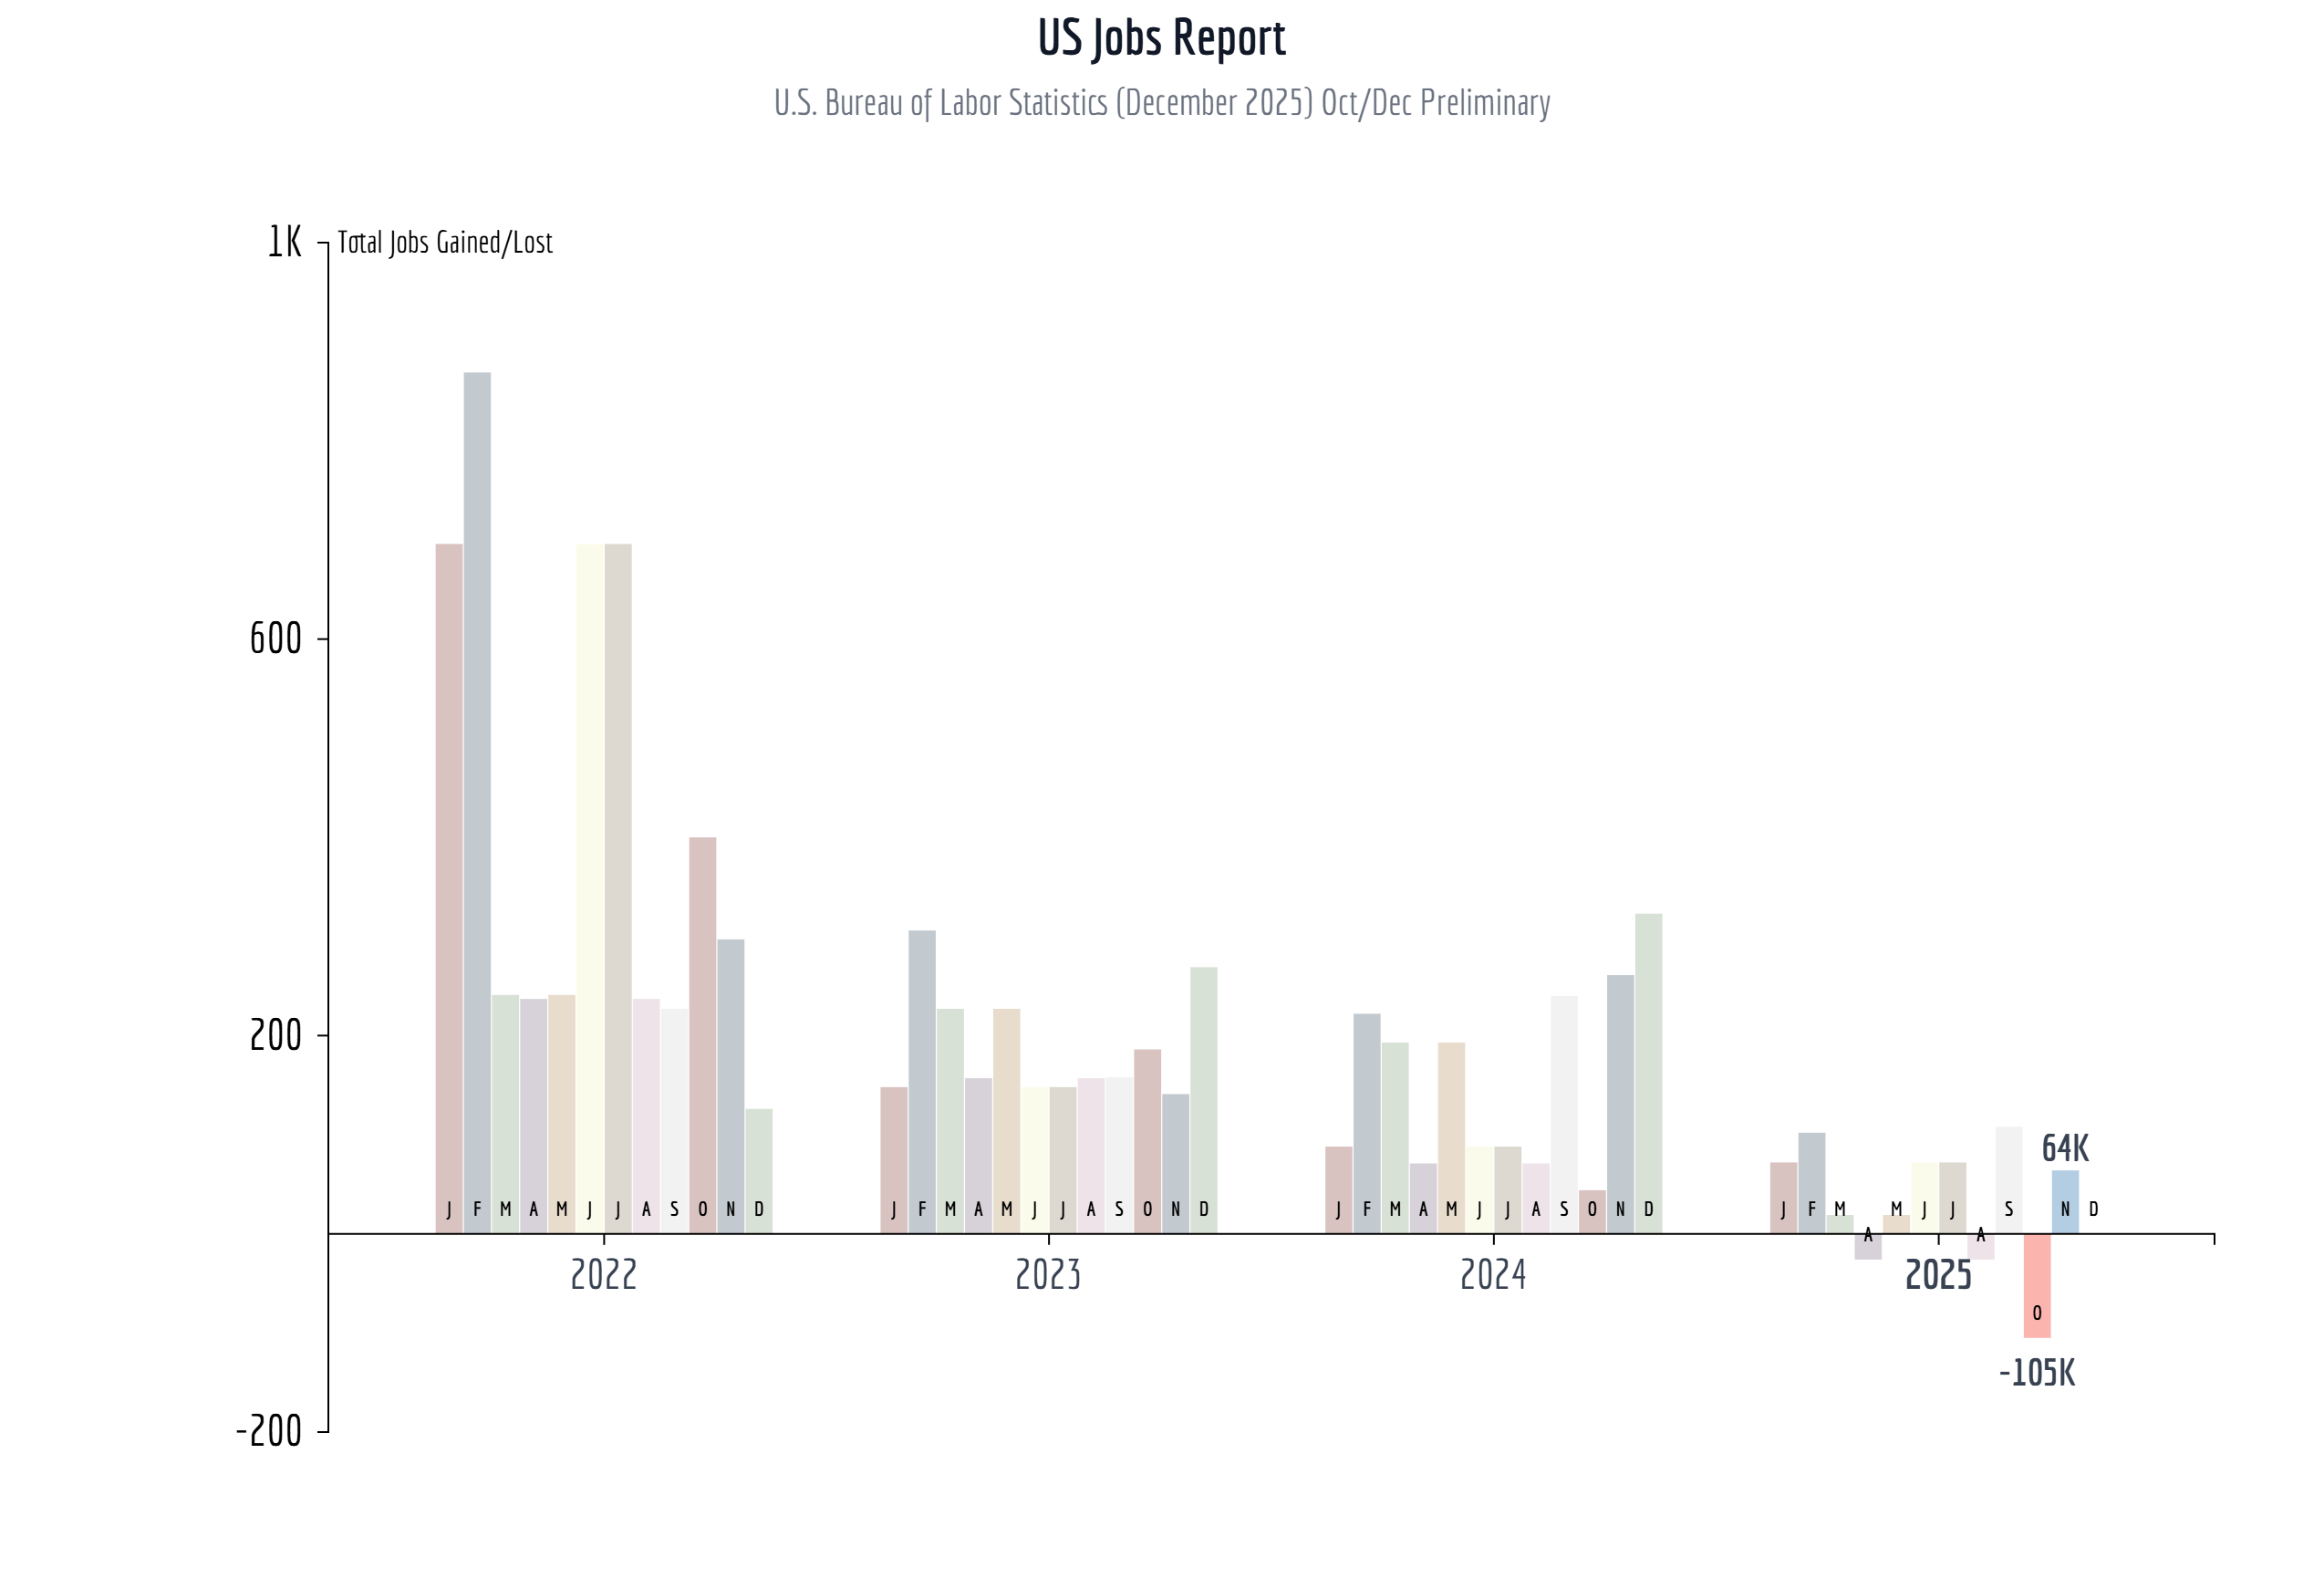
Support the Story
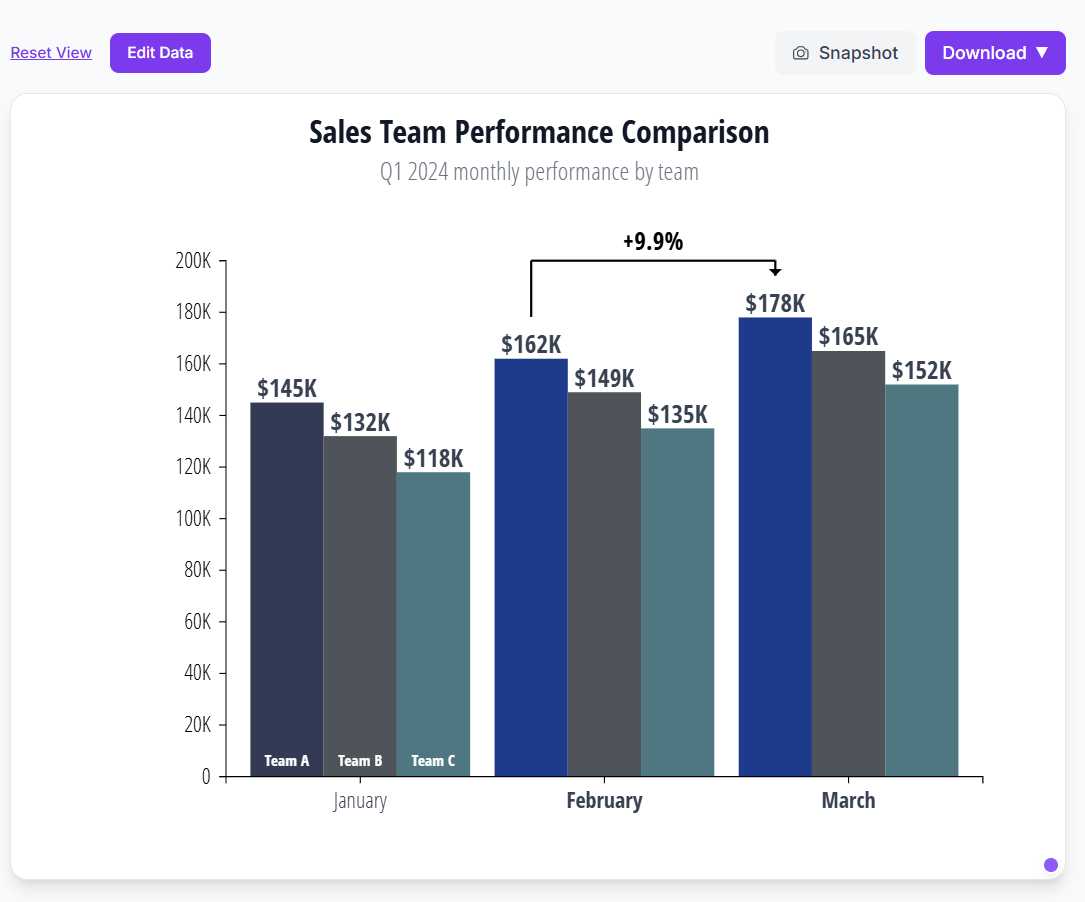
Style every detail—colors, fonts, labels, gridlines. Add emphasis to highlight what matters. Write headlines that frame the insight. Make the message impossible to miss.
Use Anywhere
Export SVG & PNG from the web app. Insert native Figma elements from the plugin. No screenshots, no blurry images. Sharp charts in every presentation tool.


