
How many times have you seen a dashboard tell a good story?
Despite everyone’s best intentions, dashboards consistently fail at telling compelling stories. As someone who has spent years building and implementing dashboard solutions, I’ve heard the phrase “make the dashboard tell a story” more times than I can count.
But I’ve come to believe this is fundamentally wrong.
Make no mistake, I love dashboards. They are powerful tools for helping us visualize and explore data.
But they are a terrible place to tell a good story.
Let me show you four reasons why this happens, and suggest a powerful alternative that can transform how your organization communicates with data.
Why Dashboards Fail as Storytellers
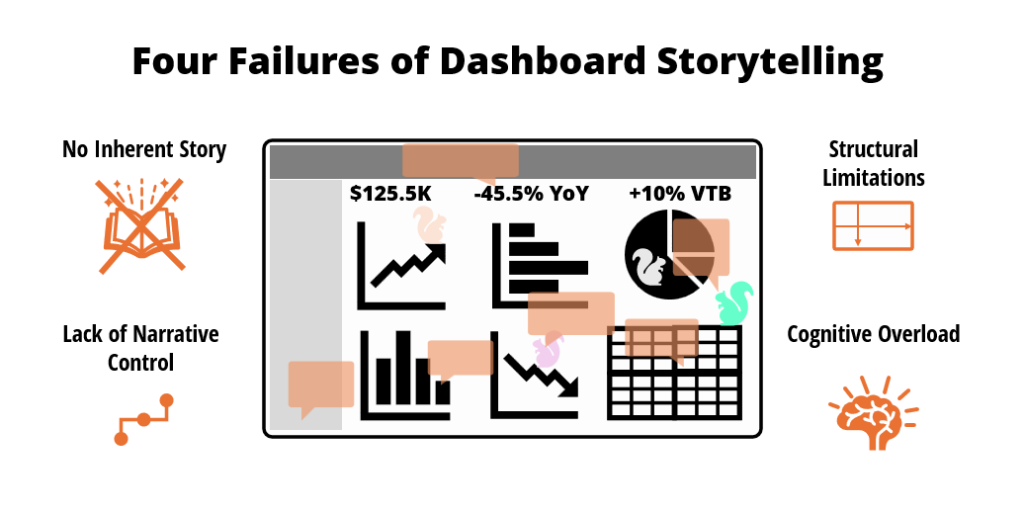
1. No Inherent Story
Dashboards are well-designed to display data, but before you can tell a story using them, you need to have a story worth telling. This requires analyzing and interpreting that data to uncover meaningful insights first. Dashboards are great places to start finding elements of a story, but they don’t inherently contain one.
They show the “whats” but cannot tell you the “whys” or “so whats”. You still must work to find and connect them.
2. Structural Limitations
All dashboards have fixed space constraints. We’ve become adept at cramming lots of data, visuals, and controls into them. But now trying to add a story in these confined spaces just doesn’t work. Stories require progression, sequencing, and emphasis. Putting all of this into a single scene is impossible.
It’s like trying to watch a movie by looking at all frames simultaneously.
3. Lack of Narrative Control
A dashboard has no way to control where your audience looks or in what order they process information. A proper story needs narrative order to manage the flow of information, explain interpretations, and convey the meaning you want your audience to receive. Without narrative control, your audience will meander and look all over the dashboard and easily miss the focus of your story entirely.
Your audience will start to form their own stories from all the different information.
4. Cognitive Overload
A common problem with all dashboards is the overwhelming amount of information they present. Trying to force a coherent story into this situation further compounds this overload. Your audience automatically checks out when faced with too much information. Adding in a story that they now must listen and see pushes them overboard quicker.
A good story by nature reduces cognitive load by properly separating information in a linear, digestible format. It’s easier to absorb a story one bite at a time.
A Better Approach: Narrative Reporting
So, is there a better approach? I think so.
Most organizations can benefit tremendously from what is called narrative reporting.
A narrative report is a well-structured document that integrates storytelling techniques to explain the data performance with relevant context and interpretations so your audience can better see and understand the forces shaping the data.
While these reports use narrative elements, they aren’t a story either. They are structured explanations that make understanding the business performance – easier.
A narrative report simplifies, explains, and orients your audience on business performance, preparing them to evaluate and discuss what to do next.
These reports also aren’t suited for a dashboard either. They require additional effort to develop, but the payoff in comprehension and decision quality is immense.
Imagine a sales dashboard showing a 15% drop last quarter. The dashboard shows WHAT happened, but a narrative report will also include WHY it happened (competitive pricing changes + supply chain disruptions) and WHAT leadership should consider doing about it (discuss sales promotion & make good).
The Power of Narrative Reports
Let’s look closer at some of the key reasons a narrative report can help your organization better share and communicate with data.
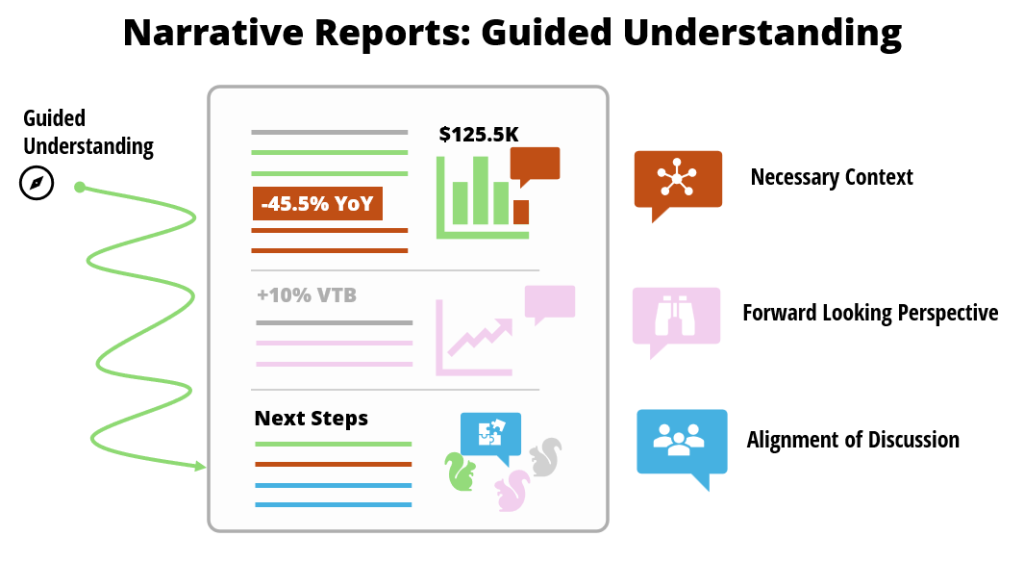
1. Guided Understanding
A narrative report helps align your audience’s attention to the key performance areas that matter most. It carefully relays relevant context to the impacted business performance and draws proper interpretations, ensuring everyone understands not just the metrics but in the order of significance to the business.
Your audience should care very differently about net profit vs. ad impressions. Make it easy for them to focus on the important metrics.
2. Necessary Context
Narrative reports include critical context, both internal and external that impacted the numbers. It’s not just about what the numbers are, but the operating environment that shaped them. This context is often impossible to derive or include effectively in dashboard visualizations alone.
Your audience cares about the numbers, but it’s much more important to know the context that impacted it.
3. Forward-Looking Perspective
Unlike dashboards which are, by nature, historical perspectives, narrative reports help turn your audience’s focus onto future implications. With an understanding of what, why, and the context that shaped the performance. You can now shape your audiences considerations on how to influence future performance.
By nature, we talk a lot about what happened in the past. However, there is nothing we can change about it. We must look at what we can do about it.
4. Alignment of Discussion
Most importantly, good narrative reports facilitate meaningful discussions. With performance data and context presented clearly, decision-makers are better prepared to argue, debate, and commit to what actions to take next. This alignment is where real value emerges.
The best organizations have the most authentic dialogues about how to improve the business in the future. Candid discussions will most often lead to better decisions.
This is not a radical concept
The truth is this approach isn’t revolutionary. Executives already rely on and deliver narrative reports in the form of annual reports and financial filings. They understand and share complex business performance using narratives, not just charts and graphs.
We’re simply bringing this proven approach to the rest of the business.
The goal of narrative reporting is to improve comprehension on the forces driving business performance. Reporting only tells us what happened in the past. Adding a narrative to that performance with a focus on the future enables leaders to understand quicker, discuss options, and make better decisions that ultimately achieve better outcomes.
Getting Started Is Easy
Implementing narrative reporting doesn’t require expensive new tools either.
Start by taking your existing reporting and adding three elements:
- Context explaining WHY metrics changed.
- Interpretations of what these changes MEAN.
- Suggestions for what leaders might DO about it.
By adding this additional information, you will start to form better interpretations and recommendations for your leadership to consider.
Please, stop trying to make dashboards tell a story
Instead, let dashboards do what they’re designed for, exploring data to find the story.
Commit to try and improve your normal reporting into narrative reports that guide understanding, provide context, and drive meaningful discussions.
Narrative reports excel at providing interpretations and guidance to your leadership team. They might be the most important communication tool you’re not yet using. Your leadership will thank you for the clarity and understanding they bring.